Why Location Is the Most Critical Decision in Bubble Tea Franchising
Location determines up to 80% of your bubble tea franchise’s performance before you open.
Three factors decide whether your outlet thrives or struggles: foot traffic density, demographic alignment, and visibility from key walking paths. Get any of these wrong and even exceptional product quality won’t compensate.
Bubble tea operates on impulse purchases. Customers buy because they’re already walking past, not because they’ve planned a trip to your store. This means your location must intersect with existing customer journeys. Expecting people to seek you out is a strategy for failure.
Chatime’s franchise model recognises this reality. The system provides location criteria based on performance data from 120+ outlets across Australia and 1,000+ globally. Structured site selection reduces location-related failures by positioning outlets where demand already exists, not where you hope it might develop.
The difference between our top-performing outlet (turning over $1.8M annually at Chadstone Shopping Centre) and an underperformer (struggling at $400K in a low-traffic suburban strip) usually comes down to location fundamentals established before opening day.
What Customer Profiles Drive Bubble Tea Foot Traffic?
Four distinct customer types determine whether a location will work.
Students aged 16-25 form the core. They buy between classes, during study breaks, and as social currency. They cluster around educational institutions, transport hubs connecting to campuses, and entertainment precincts. Our UNSW Sydney outlet sees 60% of weekday sales between 11am-3pm and 4pm-7pm, timed exactly to class schedules.
Office workers aged 25-35 provide afternoon and post-work revenue. They purchase bubble tea as a 3pm energy boost or social drink after finishing work. These customers frequent business districts and shopping centres within walking distance of offices. Chatime Martin Place captures this profile during Sydney’s CBD lunch and after-work peaks.
Families with teenagers create weekend demand in suburban shopping centres. While not daily customers, they purchase multiple drinks per visit. Average transaction values from family groups run 40-50% higher than solo purchases.
Tourists and casual shoppers provide supplementary revenue in high-visibility retail areas. They’re drawn by visual appeal and novelty. Storefront presentation matters most for this segment.
Successful locations capture at least two of these customer types consistently. Our Westfield Parramatta outlet intersects all four throughout the day: students before and after classes, office workers at lunch, families on weekends, tourists exploring the precinct.
Single-customer-type locations create vulnerability. University-adjacent sites can drop 70% during semester breaks. Pure office locations die on weekends.
Which Location Types Consistently Perform Best for Bubble Tea Shops?
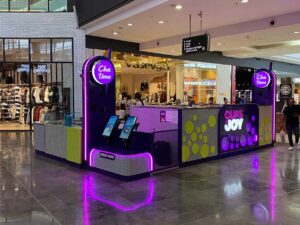
Shopping centres deliver the highest performance, particularly food courts and high-traffic retail corridors.
The controlled environment, extended trading hours, and diverse customer mix create ideal conditions for impulse purchases. Chatime Chadstone and Bondi Junction consistently rank among our top-performing outlets nationally, benefiting from 50,000+ weekly visitors and customer dwell times exceeding 90 minutes.
University precincts generate strong weekday traffic with high repeat frequency. These locations benefit from predictable daily patterns and customer loyalty during academic terms. Our UNSW, RMIT Melbourne, and UQ St Lucia outlets demonstrate this clearly, with morning peaks at 10-11am and afternoon surges at 3-5pm tied directly to class schedules.
Transport hubs capture customers during commute transitions. Our Central Station Sydney and Southern Cross Station Melbourne outlets represent high-conversion environments where commuters make quick decisions. Morning and afternoon peaks create predictable revenue windows.
High street retail strips in dense suburbs perform well when positioned near complementary businesses. Chapel Street in Melbourne and King Street in Newtown show how the right retail mix amplifies foot traffic. These locations need careful demographic verification because high street performance varies dramatically block by block.
Mixed-use developments combining residential, retail, and office components provide customer streams throughout different times and days. Barangaroo in Sydney and Docklands in Melbourne exemplify this model.
Location types to avoid: standalone sites without foot traffic generators, industrial areas, purely residential streets without retail clustering. These require customers to make special trips, which contradicts bubble tea purchasing behaviour.
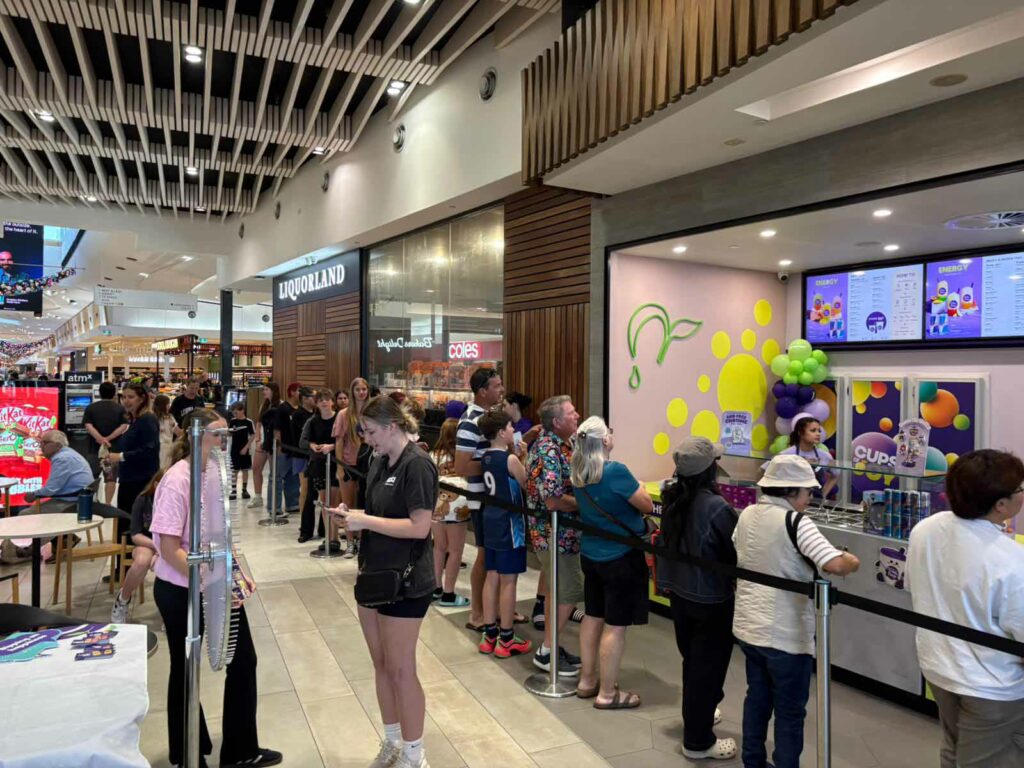
What Foot Traffic Benchmarks Should You Look For?
Minimum viable foot traffic is 2,000 people passing your storefront daily during trading hours.
Shopping centres and food courts need 3,000-5,000 daily passers-by because conversion rates drop in high-choice environments. University precincts can work with lower absolute numbers if demographic concentration is strong (70%+ students).
Peak hour concentration matters more than total daily numbers. Locations with strong lunchtime (12pm-2pm) and afternoon (3pm-6pm) patterns align with bubble tea purchase timing. Even distribution throughout the day often indicates weak purchasing drivers.
Weekend foot traffic should represent at least 40% of weekday levels for suburban locations. Drops below this threshold signal over-dependence on weekday office workers or students.
Demographic quality counts as much as quantity. Areas where 60%+ of pedestrians fall within the 16-35 age range typically outperform locations with older demographic profiles. Our Chapel Street outlet captures this sweet spot, while a site in Brighton (older, wealthier demographic) struggled despite comparable foot traffic volumes. That outlet closed after 18 months.
Visibility from foot traffic paths determines conversion rates. Storefront visibility from at least 20 metres in the primary direction of pedestrian flow captures impulse purchases. Recessed locations or upper-level positions in shopping centres lose 30-40% of potential customers who simply don’t notice the outlet.
Chatime’s site assessment includes traffic counting methodologies across multiple days and time periods. We count Tuesday-Thursday for baseline weekday patterns, Saturday for weekend verification, and during both peak and off-peak hours. This captures realistic patterns, not isolated peak moments that create false expectations.
How Does Proximity to Competitors and Complementary Businesses Affect Performance?
Direct bubble tea competition within 100 metres typically reduces performance by 20-30%.
However, complete category dominance doesn’t guarantee success if underlying foot traffic or demographics are weak. The key is sufficient demand to support your outlet without oversaturation.
Our Box Hill outlet operates within 150 metres of three competitors (Gong Cha, CoCo, and The Alley) but generates strong sales because the precinct’s Asian student population creates demand that supports multiple operators. Conversely, a sole bubble tea outlet in a low-traffic suburban strip will struggle regardless of competitive absence.
Complementary businesses enhance performance through synergistic foot traffic:
Phone and electronics stores (JB Hi-Fi, Apple, Officeworks) attract younger demographics who browse, compare, and spend extended time in precincts.
Fashion retailers targeting 16-30 year-olds (Cotton On, Uniqlo, H&M) create natural customer overlap.
Gaming centres and entertainment venues (Timezone, Hoyts, Event Cinemas) generate pre and post-activity purchasing. Our Macquarie Centre outlet benefits significantly from the adjacent cinema complex.
Quick-service food options (Guzman y Gomez, Grill’d, Boost Juice) indicate proven food traffic and shared customer bases. Clustering near other quick-service outlets usually strengthens performance by creating a food and beverage destination.
Education-adjacent businesses like stationery stores (Kikki.K, Typo), bookshops (Dymocks), and computer services signal student concentration.
Avoid areas dominated by businesses targeting older demographics: medical practices, traditional banking branches, mobility aids retailers. Foot traffic won’t align with bubble tea customer profiles.
Chatime’s territory planning ensures franchisees enter markets with adequate demand and manageable competition. We assess not just current competitors but pipeline applications and likely new entrants based on market conditions.
What Site Characteristics Can Make or Break a Bubble Tea Outlet?
Storefront visibility from primary pedestrian flow determines whether customers notice your outlet before deciding to purchase elsewhere.
Ground floor positions with clear sightlines outperform upper levels significantly. Our Pitt Street Mall outlet (ground floor, corner position) captures 40% more customers than a comparable upper-level site in the same precinct despite similar absolute foot traffic.
Wondering if there’s a spot open in your city?
Ceiling height affects both operational efficiency and customer perception. Minimum 3-metre ceilings accommodate equipment requirements and create the open, modern atmosphere that appeals to bubble tea customers. Compressed spaces feel cramped and uninviting.
Power and water infrastructure must support high-volume beverage preparation. Three-phase power and adequate water pressure aren’t negotiable. Locations requiring significant electrical or plumbing upgrades erode profitability through fitout costs exceeding $50,000 and construction delays pushing back revenue commencement.
Parking availability influences accessibility, particularly for suburban locations. Even urban outlets benefit from short-term parking (15-30 minute limits) for customers collecting orders. Our successful suburban outlets typically have 20+ car spaces within 50 metres.
Public transport connectivity expands catchment beyond immediate walking radius. Locations within 200 metres of train stations or major bus routes see 15-25% higher customer volumes. Transport connectivity also influences staffing, making it easier to attract reliable team members.
Storage space for ingredients, cups, and packaging affects operational efficiency. Insufficient back-of-house space (minimum 8-10 sqm required) creates ongoing logistical challenges and higher labour costs through increased restocking frequency.
Neighbouring tenants impact positioning and customer perception. Locations alongside quality food retailers (Fishbowl, Sushi Sushi), popular chain stores (Cotton On, Kmart), or professional services enhance credibility and shared foot traffic. Locations next to vacant tenancies, discount stores, or struggling businesses face customer perception challenges.
Shopfront width matters more than total floor area. Minimum 4-metre frontage creates adequate visibility and queue management. Narrow, deep spaces look unappealing and create operational bottlenecks during peak periods.
How Does Chatime Approach Site Selection for New Franchisees?
Chatime’s site selection starts with demographic mapping using customer profile data from 120+ Australian outlets, not generic retail analytics.
This identifies suburbs and precincts where bubble tea demand is strongest before evaluating specific sites. We overlay population density, age distribution, household income, and education levels to create heat maps of high-potential areas.
Traffic analysis includes quantitative counts and qualitative assessment of pedestrian flow patterns, peak periods, and demographic composition. Our team conducts minimum three-day counts (Tuesday, Thursday, Saturday) across morning, midday, and afternoon periods. This dual approach ensures locations have both sufficient volume and appropriate customer types.
Competitive landscape assessment considers direct bubble tea competitors and broader quick-service food options. We map every bubble tea outlet within 2km radius and assess market saturation using sales density ratios (population per outlet). Territory planning prevents franchisee conflicts while maximising market coverage.
Site scoring methodology weights factors based on performance data from existing outlets:
- Foot traffic (30%)
- Demographics (25%)
- Visibility and accessibility (20%)
- Competitive environment (15%)
- Site characteristics (10%)
This creates objective evaluation rather than subjective assessment. Sites scoring below 70/100 are rejected regardless of rent levels or franchisee preference.
Lease negotiation support helps franchisees secure favourable terms on rent, tenure, and fitout contributions. Our franchise team understands landlord negotiations and market rental rates across major Australian retail precincts. We’ve negotiated rent-free fitout periods, percentage rent structures, and tenant improvement allowances that independent operators rarely access.
Ongoing location performance monitoring identifies successful site characteristics and refines selection criteria. This continuous improvement process benefits all franchisees. Analysis of our top-performing outlets revealed that corner positions outperform inline locations by 35% on average, leading to updated site selection priorities.
The comprehensive approach means franchisees receive location recommendations based on proven success factors rather than making uninformed decisions about their largest investment.
I personally review site assessments for franchisees in Queensland and have seen how this systematic process eliminates emotional decision-making. One recent franchisee wanted a site near her home in an outer suburban area with weak demographics. Our analysis showed projected annual turnover of $380K against required $650K for viability. We redirected her to a Westfield North Lakes location 15km away that opened six months ago and is now tracking toward $920K in year one.
Common Location Mistakes First-Time Franchisees Make
Choosing locations based on low rent rather than customer potential is the most expensive mistake.
Cheap rent in areas without foot traffic or appropriate demographics leads to ongoing revenue struggles that far exceed any rental savings. A site at $3,000/month generating $25,000 in monthly sales delivers worse returns than a $7,000/month site generating $65,000. Franchisees fixate on minimising costs rather than maximising returns.
Overestimating the drawing power of bubble tea itself leads to poor location decisions. While bubble tea has strong appeal, customers won’t detour to inconvenient locations when convenient alternatives exist. One franchisee in outer western Sydney chose a standalone site in a residential street, assuming the concept alone would attract customers. It didn’t. The outlet closed after 14 months.
Ignoring peak hour timing when evaluating foot traffic creates misleading assessments. Locations busy during non-trading hours or periods when bubble tea sales are historically low won’t generate expected revenue. A site near office buildings might look busy at 8am and 5pm but be dead during actual peak bubble tea purchasing windows (11am-2pm, 3pm-6pm).
Underestimating fitout costs and timeframes for challenging sites erodes working capital and delays opening. Complex sites requiring significant modifications often become financial burdens. Budget blowouts of $40,000-60,000 on difficult fitouts deplete the working capital needed for initial trading periods.
Failing to verify demographic assumptions with actual observation leads to mismatched expectations. Areas that appear student-heavy may skew older during key trading periods. Conduct your own counts and observations rather than relying on landlord representations or demographic reports alone.
Assuming all shopping centre locations are equivalent ignores significant performance differences between prime positions and secondary locations within the same complex. A food court position near the main entrance outperforms a corner location near the loading dock, even in the same centre. Position within the precinct matters as much as the precinct itself.
Not considering future development plans for surrounding areas can result in locations facing reduced foot traffic, increased competition, or changed demographic patterns. Check council development applications and speak with neighbouring tenants about upcoming changes. One franchisee opened near Griffith University Nathan campus without realising the institution was relocating two faculties to Gold Coast within 18 months, cutting student foot traffic by 40%.
Signing leases without proper legal review and understanding of outgoings, rent escalation clauses, and renewal terms. Hidden costs in poorly negotiated leases erode profitability over time.
Chatime’s structured approach helps franchisees avoid these pitfalls through systematic location evaluation and experienced guidance throughout site selection.
Ready to Find Your Location? Here Is How to Start
Location selection is a skill, not guesswork. The investment in proper site evaluation pays dividends throughout your franchise ownership.
Chatime’s proven systems remove uncertainty from location decisions. Rather than navigating site selection alone, franchisees benefit from established criteria, demographic analysis tools, and ongoing support throughout the process.
The franchise model provides access to preferred locations, lease negotiation expertise, and performance benchmarks that independent operators cannot access. This systematic approach significantly improves your chances of choosing a location that delivers strong returns.
Starting your site selection journey means connecting with Chatime’s franchise team to understand available territories, demographic mapping, and location criteria specific to your market area. We’ll walk you through:
- High-potential precincts in your preferred region
- Demographic analysis of specific suburbs and shopping centres
- Competitive landscape and territory availability
- Site scoring methodology and assessment process
- Financial projections based on comparable locations
- Lease negotiation support and timeline expectations
Every successful Chatime franchisee began by understanding that the right location, backed by proven systems and ongoing support, creates the foundation for sustainable business success.
Franchise opportunities Down Under
Your bubble tea business begins here.
Frequently Asked
Choosing the right location for your Chatime.
Foot traffic numbers, lease terms, demographics — everything that goes into picking a viable bubble tea site, plus how the Chatime team helps.
What foot traffic numbers indicate a viable bubble tea location?
Minimum 2,000 daily pedestrians passing the storefront during trading hours for street-level retail, with shopping centres and food courts needing 3,000–5,000 daily passers-by. Peak hour concentration (12pm–2pm, 3pm–6pm) matters more than total daily volume.
Demographic quality also counts: locations where 60%+ of pedestrians are aged 16–35 typically outperform sites with comparable traffic but older demographics.
How important is proximity to schools and universities for bubble tea success?
Educational institutions create ideal customer concentrations. Locations within 500 metres of universities, TAFEs, or large secondary schools typically see 40–60% higher sales volumes than comparable non-education locations.
However, semester breaks create revenue vulnerability. Our university-adjacent outlets typically experience 30–50% revenue drops during summer holidays and mid-year breaks, requiring careful cash flow management.
Can bubble tea shops succeed in suburban locations?
Suburban success depends entirely on foot traffic generators like shopping centres, transport hubs, or high-density residential precincts. Suburban shopping centres with strong anchor tenants (Coles, Woolworths, Kmart) can outperform CBD locations.
Standalone suburban sites without pedestrian flow rarely achieve viable sales. Our successful suburban outlets are all located in shopping centres with 20,000+ weekly visitors.
What lease terms should I negotiate for a bubble tea location?
Seek 5–10 year initial terms with renewal options protecting your investment in fitout and brand building. Negotiate percentage rent caps (typically 10–12% of gross sales), rent-free fitout periods (6–12 weeks), and tenant improvement allowances where possible.
Understand outgoings clearly and ensure rent escalation clauses (typically 3–4% annually or CPI) are sustainable against projected revenue growth. Chatime’s franchise support helps secure favourable lease conditions that protect long-term profitability.
How does Chatime help franchisees find the right location?
Chatime provides demographic mapping, site scoring methodology, competitive analysis, traffic counting protocols, and lease negotiation support. Franchisees receive location recommendations based on proven success criteria from 120+ Australian outlets rather than making uninformed decisions.
The process includes three-day traffic counts, demographic verification, competitive landscape assessment, and financial projections based on comparable locations. Site selection support continues from initial territory identification through lease signing and opening preparation.
What happens if my preferred location doesn’t meet Chatime’s site criteria?
The franchise team will explain specifically why the location doesn’t meet criteria and what performance challenges to expect. If a franchisee insists on proceeding with a non-recommended site, Chatime reserves the right to decline the location to protect both franchisee investment and brand reputation.
This happened twice in Queensland last year, where franchisees wanted sites in low-traffic areas. Both were redirected to alternative locations that are now performing strongly. Protecting franchisees from poor location decisions is part of the ongoing support model.